在 matplotlib 条形图上添加值标签
matplotlibserver side programmingprogramming更新于 2024/9/10 4:30:00
在此程序中,我们可以初始化一些输入值,然后尝试使用这些值绘制条形图。我们可以实例化一个图形和轴,以便设置标签、刻度并注释条形的高度和宽度。
步骤
列出年份。
列出该年的人口。
使用 np.arrange(len(years)) 方法获取标签数量。
设置条形的宽度。
使用 subplots() 方法创建 fig 和 ax 变量,其中默认 nrows 和 ncols 为 1。
使用 set_ylabel() 设置图形的 Y 轴标签。
使用 set_title() 设置图形的标题。
使用使用 set_xticks 方法,在步骤 3 中创建 x。
使用 set_xticklabels 方法,将 xtick_labels 设置为年份数据。
使用 ax.bar() 制作绘图条。
迭代条形容器(来自步骤 10)以注释设置每个条形的值。
使用 plt.show() 显示图形。
示例
from matplotlib import pyplot as plt
import numpy as np
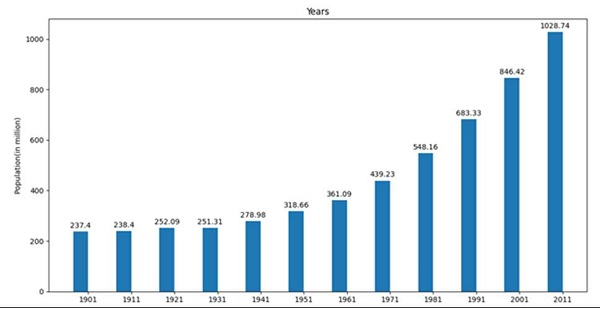
years = [1901, 1911, 1921, 1931, 1941, 1951, 1961, 1971, 1981, 1991, 2001, 2011]
population = [237.4, 238.4, 252.09, 251.31, 278.98, 318.66, 361.09, 439.23, 548.16, 683.33, 846.42, 1028.74]
x = np.arange(len(years)) # the label locations
width = 0.35 # the width of the bars
fig, ax = plt.subplots()
ax.set_ylabel('Population(in million)')
ax.set_title('Years')
ax.set_xticks(x)
ax.set_xticklabels(years)
pps = ax.bar(x - width/2, population, width, label='population')
for p in pps:
height = p.get_height()
ax.annotate('{}'.format(height),
xy=(p.get_x() + p.get_width() / 2, height),
xytext=(0, 3), # 3 points vertical offset
textcoords="offset points",
ha='center', va='bottom')
plt.show()
输出