修复 Matplotlib 中散点图的颜色
matplotlibserver side programmingprogramming
要修复 matplotlib 中散点图的颜色,我们可以采取以下步骤 −
使用 numpy 创建 xs 和 ys 随机数据点。
使用十六进制字母创建一组颜色,长度等于 ys。
使用 scatter() 方法绘制列表 xs 和 ys,并使用颜色列表。
要显示图形,请使用 show() 方法。
示例
import random
import numpy as np
from matplotlib import pyplot as plt
plt.rcParams["figure.figsize"] = [7.00, 3.50]
plt.rcParams["figure.autolayout"] = True
xs = np.random.rand(100)
ys = np.random.rand(100)
colors = ["#" + ''.join([random.choice('0123456789ABCDEF') for j in range(6)])
for i in range(len(xs))]
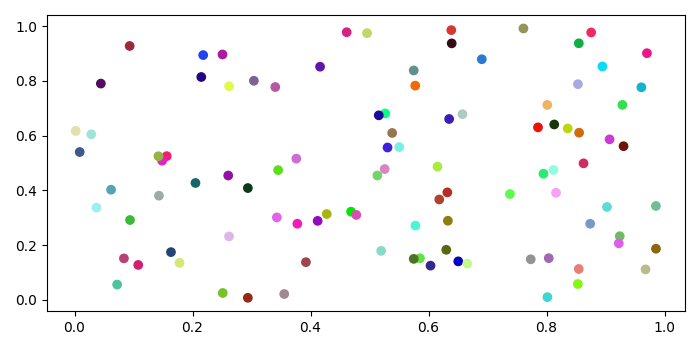
plt.scatter(xs, ys, c=colors)
plt.show()
输出