在 matplotlib 中隐藏轴值但保留轴刻度标签
matplotlibserver side programmingprogramming更新于 2025/5/13 1:22:17
要隐藏轴值但保留轴刻度标签,我们可以执行以下步骤 −
使用 plot( ) 方法绘制一条线。
使用 x label 和 y label 方法设置 X 和 Y 标签。
使用 plt.gca() 获取当前轴,如有必要创建一个。
使用 xaxis.set_ticklabels() 和空列表。
使用 yaxis.set_ticklabels() 和空列表。
要显示图表,请使用 plt.show() 方法。
示例
import matplotlib.pyplot as plt
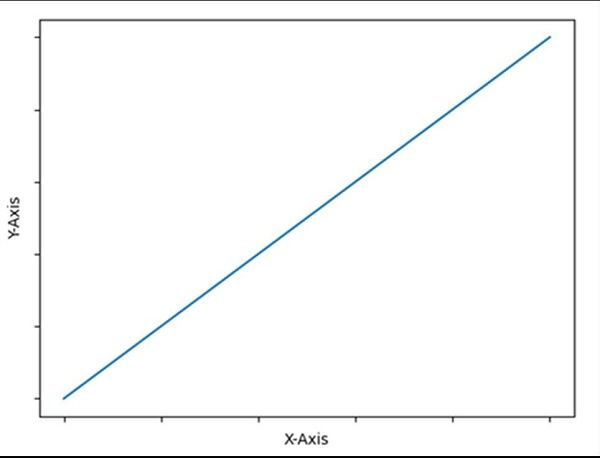
plt.plot([0, 5], [0, 5])
plt.ylabel("Y-axis ")
plt.xlabel("X-axis ")
ax = plt.gca()
ax.axes.xaxis.set_ticklabels([])
ax.axes.yaxis.set_ticklabels([])
plt.show()
输出