如何使用 Matplotlib 制作简单的 3D 线条?
matplotlibserver side programmingprogramming
要使用 matplotlib 制作简单的 3D 线条,我们可以采取以下步骤 −
创建一个新图形或激活现有图形。
将轴添加到图形作为子图排列的一部分。
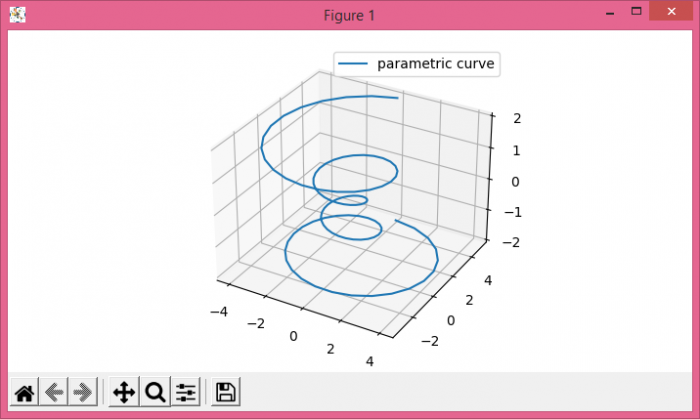
使用 numpy 为 theta、z、r、x 和 y 创建数据点。
使用 plot() 方法绘制 x、y 和 z。
使用 legend() 方法在图上放置图例。
要显示图形,请使用 show() 方法。
示例
import numpy as np
from matplotlib import pyplot as plt
plt.rcParams["figure.figsize"] = [7.00, 3.50]
plt.rcParams["figure.autolayout"] = True
fig = plt.figure()
ax = fig.add_subplot(projection='3d')
theta = np.linspace(-4 * np.pi, 4 * np.pi, 100)
z = np.linspace(-2, 2, 100)
r = z**2 + 1
x = r * np.sin(theta)
y = r * np.cos(theta)
ax.plot(x, y, z, label="parametric curve")
ax.legend()
plt.show()
输出