如何在 matplotlib 中绘制直方图,使得条形图的高度总和为 1?
matplotlibserver side programmingprogramming更新于 2025/5/11 10:37:17
在 plt.hist() 方法中,stacked=True 可以帮助使条形图的高度总和为 1。
步骤
创建一个数字列表。
使用 plt.hist(),我们可以绘制直方图。
stacked : bool,默认值:False
如果为"True",则多个数据堆叠在一起;如果为"False",则如果 histtype 为"bar",则多个数据并排排列或者如果 histtype 为"step",则相互叠加。
density : bool, default: False
如果为"True",则绘制并返回概率密度:每个 bin 将显示 bin 的原始计数除以计数总数*和 bin 宽度*。
要显示该图,请使用 plt.show() 方法。
示例
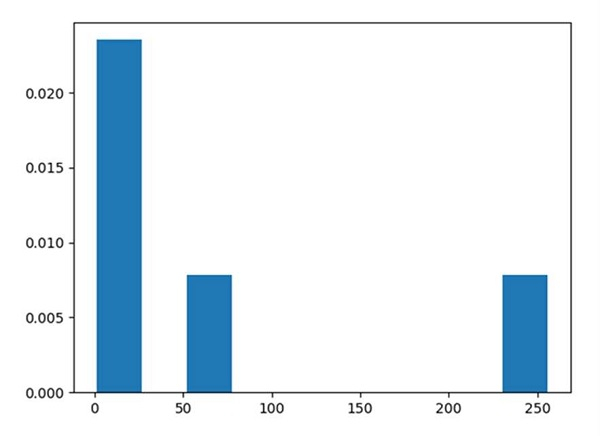
from matplotlib import pyplot as plt

x = [1, 4, 16, 64, 256]

# stacked 和 density 为真,则直方图的总和将标准化为 1。
plt.hist(x, 10, stacked=True, density=True)
plt.show()
输出