如何在 Matplotlib 中用逗号将轴数字格式格式化为千位数字?
matplotlibserver side programmingprogramming更新于 2025/5/10 12:52:17
首先,我们可以创建两个 x 和 y 列表,其中的值将超过 1000。然后,我们可以使用 ax.yaxis.set_major_formatter 方法,其中可以传递 StrMethodFormatter('{x:,}') 方法和 {x:,} 格式化程序,这有助于从给定的数字集中分离出 1000 个数字。
步骤
创建两个数字大于 2000 的列表。
使用 subplots 方法创建 fig 和 ax 变量,其中默认 nrows 和 ncols 为 1,使用 subplot() 方法。
使用 x 和 y 绘制线条(来自步骤1).
使用 ax.yaxis.set_major_formatter() 方法设置主行情的格式化程序,其中 StrMethodFormatter 有助于使用通用表达式 {x:,} 制作 1000。使用新样式的格式字符串(如 'str.format' 所用)来格式化刻度。
使用 ax.xaxis.set_major_formatter() 方法设置主行情的格式化程序,其中 StrMethodFormatter 有助于使用通用表达式 {x:,} 制作 1000。使用新样式的格式字符串(如 'str.format' 所用)来格式化刻度。
要显示图形,请使用 plt.show() 方法。
示例
import matplotlib.pyplot as plt
from matplotlib.ticker import FormatStrFormatter, StrMethodFormatter

x = [10110, 20110, 40110, 6700]

y = [20110, 10110, 30110, 9700]

fig, ax = plt.subplots()
ax.plot(x, y)
ax.yaxis.set_major_formatter(StrMethodFormatter('{x:,}'))
ax.xaxis.set_major_formatter(StrMethodFormatter('{x:,}'))

plt.show()
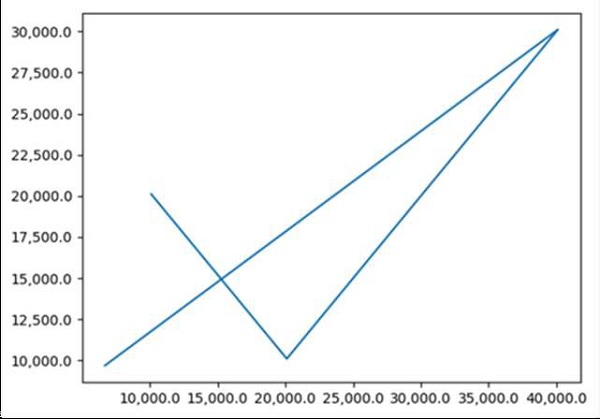
输出