如何在 Spyder/Ipython/matplotlib 中再次获取交互式图表?
matplotlibserver side programmingprogramming更新于 2025/5/12 23:22:17
要获取交互式图表,我们需要激活该图形。使用 plt.ioff() 和 plt.ion(),我们可以使用 plot 执行交互式操作。
步骤
使用 subplots 方法创建 fig 和 ax 变量,其中默认 nrows 和 ncols 为 1。
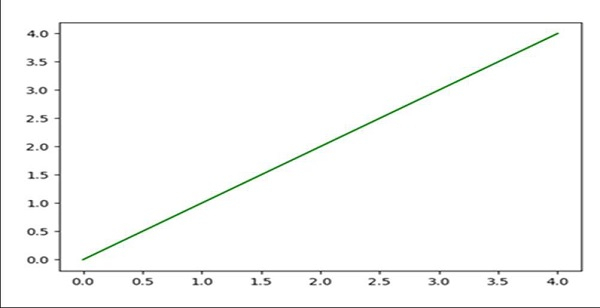
使用 plot() 方法绘制一条线。
设置线条的颜色,即橙色。
使用 plt.ioff() 方法停止交互。
要制作交互图,请更改线坐标的颜色。
使用 plt.ion() 方法开始交互。
示例
在 Ipython 中使用交互式 plot -
In [1]: %matplotlib auto

Using matplotlib backend: GTK3Agg

In [2]: import matplotlib.pyplot as plt

In [3]: fig, ax = plt.subplots()    # Diagram will get popped up, Let’s interact.

In [4]: ln, = ax.plot(range(5))     # Drawing a line

In [5]: ln.set_color('orange')      # Changing drawn line to orange

In [6]: plt.ioff()                  # Stopped interaction

In [7]: ln.set_color('green')
# Since we have stopped the interaction in the last step

In [8]: plt.ion()                   # Started interaction
输出