如何在 Matplotlib 中制作无衬线上标或下标文本?
matplotlibserver side programmingprogramming
要在 matplotlib 中制作上标或下标文本,请使用 LaTeX 表示。
步骤
使用 numpy 创建 x 和 y 数据点。
使用 plot() 方法绘制 x 和 y 数据点。
使用 title() 方法将标题与 LateX 表示一起放置。
使用 xlabel 和 ylabel 方法设置轴的标签。
示例
import numpy as np
from matplotlib import pyplot as plt
plt.rcParams["figure.figsize"] = [7.00, 3.50]
plt.rcParams["figure.autolayout"] = True
x = np.linspace(-2, 2, 10)
y = 2**x
plt.plot(x, y)
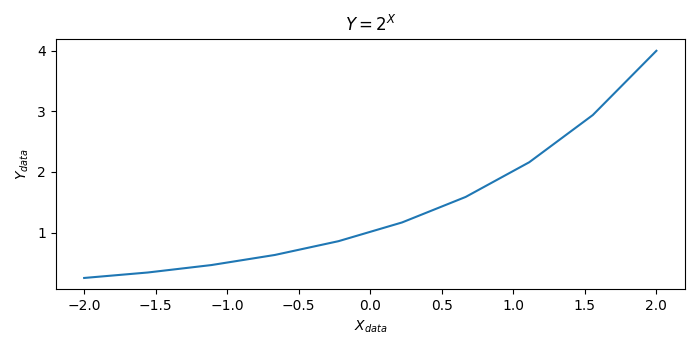
plt.title('$Y=2^{X}$')
plt.xlabel('$X_{data}$')
plt.ylabel('$Y_{data}$')
plt.show()
输出