如何在 Python 中使用 Matplotlib 绘制阶跃函数?
matplotlibserver side programmingprogramming
要在 Python 中使用 matplotlib 绘制阶跃函数,我们可以采取以下步骤 −
为 x 和 y 创建数据点。
使用 step() 方法绘制阶跃图。
要显示该图,请使用 show() 方法。
示例
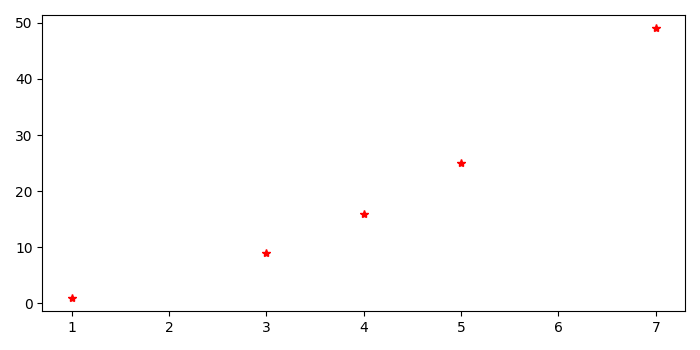
import matplotlib.pyplot as plt
import numpy as np
plt.rcParams["figure.figsize"] = [7.00, 3.50]
plt.rcParams["figure.autolayout"] = True
x = np.array([1, 3, 4, 5, 7])
y = np.array([1, 9, 16, 25, 49])
plt.step(x, y, 'r*')
plt.show()
输出