如何在 Matplotlib 中绘制多个 X 轴或 Y 轴?
matplotlibpythondata visualization更新于 2023/12/3 10:51:00
要绘制多个 X 轴或 Y 轴,我们可以使用 twinx() 或 twiny() 方法,我们可以采取以下步骤 −
使用 subplots() 方法,创建一个图形和一组子图。
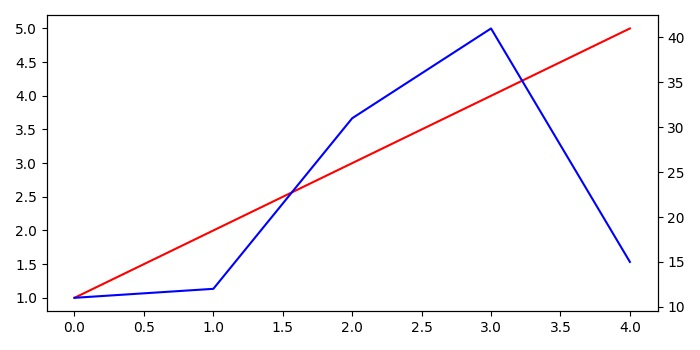
在左侧 Y 轴刻度上绘制 [1, 2, 3, 4, 5] 个数据点。
使用 twinx() 方法,创建一个具有共享 X 轴但独立 Y 轴的孪生轴,ax2。
在右侧 Y 轴刻度上绘制 [11, 12, 31, 41, 15] 个数据点,蓝色。
使用 tight_layout() 方法,调整子图之间和周围的填充。
要显示图形,请使用 show() 方法。
示例
import matplotlib.pyplot as plt
plt.rcParams["figure.figsize"] = [7.00, 3.50]
plt.rcParams["figure.autolayout"] = True
fig, ax1 = plt.subplots()
ax1.plot([1, 2, 3, 4, 5], color='red')
ax2 = ax1.twinx()
ax2.plot([11, 12, 31, 41, 15], color='blue')
fig.tight_layout()
plt.show()
输出