如何在 Python 的 Matplotlib 中获取当前图形编号?
在本文中,我们将介绍 Python 的 matplotlib 中的当前图形编号。
Matplotlib 是一个 Python 库,是 NumPy 库的数值数学扩展。Pyplot 是一个基于状态的 Matplotlib 模块接口,提供类似 MATLAB 的功能。Pyplot 中提供线图、轮廓图、直方图、散点图、3D 图和其他图。
使用 plt.gcf().number
什么是 plt.gcf()
matplotlib.pyplot.gcf() 函数主要用于获取当前图形。如果当前没有可用的图形,则使用 figure() 函数生成一个。
matplotlib.pyplot.gcf()
算法(步骤)
以下是执行所需任务需要遵循的算法/步骤 -
从 matplotlib 导入 pyplot
Pyplot 是一个 Matplotlib 模块,提供 MATLAB 风格的界面。
Matplotlib 旨在像 MATLAB 一样用户友好,但具有免费和开源的额外优势。每个 pyplot 函数都会以某种方式改变图形,例如创建图形、在图形中创建绘图区域、在绘图区域中绘制一些线条、用标签装饰绘图等。 Pyplot 支持以下绘图类型:线图、直方图、散点图、3D 图、图像、轮廓图和极坐标图
使用 import 关键字导入 numpy。
使用 arange() 函数获取从 0.1 到 2 的值范围(NumPy arange() 是一个基于数值范围的数组创建例程。它创建一个具有均匀间隔值的 ndarray 实例并返回对它的引用)。
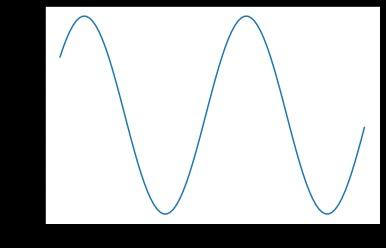
获取上述创建的 numpy 数组的正弦值并将其存储在变量中,然后将正弦值乘以 2。
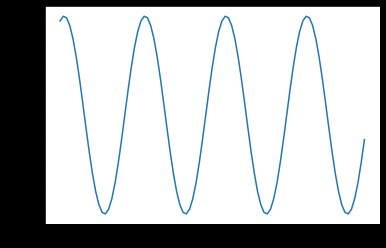
获取上述创建的 numpy 数组的正弦值并将其存储在变量中,然后将正弦值乘以 4 以显示微分
通过传递图形数量使用 pyplot 创建图形参数给 figure() 函数(函数 plt.figure() 用于创建图形对象。图形对象被视为整个图形。当我们想要更改图形的大小或在单个图形中添加多个 Axes 对象时,我们必须明确使用 plt.figure())。
使用 plot() 函数创建图(要在图中绘制点(标记),请使用 plot() 函数。默认情况下,plot() 函数从点到点绘制一条线。该函数接受用于指定图表点的参数。第一个参数是 x 轴点的数组。参数 2 是包含 y 轴点的数组)。这里我们将 arange 值作为 x 轴,将正弦值作为 y 轴。
创建具有不同正弦值的另一个图形
使用 plt.gcf() 函数的 number 属性获取当前图形编号
打印当前图形号码。
使用 show() 函数显示图表(plt.show() 启动事件循环,搜索所有当前活动的图形对象,并在一个或多个交互式窗口中显示您的图形)。
以下程序使用 plt.gcf().number 返回 Python 的 matplotlib 中的当前图形编号 −
# Importing pyplot from matplotlib as plt using the alias(as) keyword
from matplotlib import pyplot as plt
import numpy as np

# Taking sine values as numpy array
t = np.arange(0.1, 2.0)

# Sine curves
sineValues1 = np.sin(2*np.pi*t)
sineValues2 = np.sin(4*np.pi*t)

# Creating a numpy figure
plt.figure(1)

# Plotting the figure by passing sine curve values
plt.plot(t, sineValues1)

# Creating second numpy figure
plt.figure(2)

# Plotting the second figure by passing another sine curve values
plt.plot(t, sineValues2)

# Getting the current Figure number using gcf().number attribute
currentFigureNumber = plt.gcf().number

# Printing current figure number
print("Current Figure Number: ", currentFigureNumber)

# Showing the plots
plt.show()
输出
执行时,上述程序将生成以下输出 -
因为我们最近创建了第二个图形,所以当前工作图形是 2。
注意
您还可以使用文本字符串而不是数字来创建图形,例如 plt.figure("first")。在图形之间切换时,这可能比数字更容易记住。不过,plt.gcf().number 返回整数"1",表示它是一个自动编号系统。
结论
在本文中,我们学习了如何在 matplotlib 中获取当前图形编号。我们还学习了什么是 matplotlib、如何在绘图时创建图形、如何使用 gcf() 函数获取图形等等。

