Python 的 Matplotlib.pyplot.quiver 究竟是如何工作的?
matplotlibpythondata visualization
要使用 quiver,我们可以采取以下步骤 −
设置图形大小并调整子图之间和周围的填充。
使用 numpy 数组创建矢量坐标。
获取 x、y、u 和 v 数据点。
使用 figure() 方法创建新图形或激活现有图形。
使用 gca() 方法获取当前轴。
设置轴的 x 和 y 限制。
要重新绘制当前图形,使用 draw() 方法。
要显示图形,使用 show() 方法。
示例
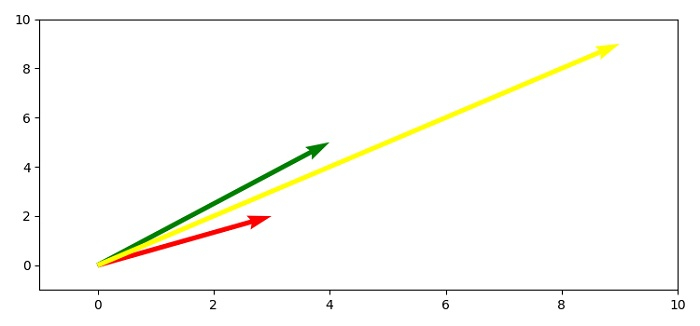
import numpy as np
import matplotlib.pyplot as plt

plt.rcParams["figure.figsize"] = [7.50, 3.50]
plt.rcParams["figure.autolayout"] = True

soa = np.array([[0, 0, 3, 2], [0, 0, 4, 5], [0, 0, 9, 9]])
X, Y, U, V = zip(*soa)
plt.figure()

ax = plt.gca()
ax.quiver(X, Y, U, V, angles='xy', scale_units='xy', scale=1, color=['red', 'green', 'yellow'])
ax.set_xlim([-1, 10])
ax.set_ylim([-1, 10])

plt.draw()

plt.show()
输出