如何使用 matplotlib 将单个标记刻度附加到 X 轴?
matplotlibpythondata visualization更新于 2023/9/28 3:43:00
要使用 matplotlib 将单个标记刻度附加到 X 轴,我们可以采取以下步骤。
步骤
设置图形大小并调整子图之间和周围的填充。
使用 numpy 创建 x 和 y 数据点。
使用 plot() 方法绘制 x 和 y 数据点。
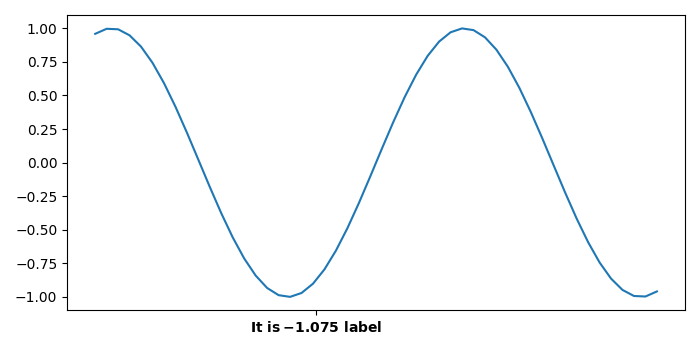
在单个点设置 xticks。
为单个刻度点设置 刻度标签。
要显示图形,请使用 Show()方法。
示例
import numpy as np
import matplotlib.pyplot as plt

# 设置图形大小
plt.rcParams["figure.figsize"] = [7.00, 3.50]
plt.rcParams["figure.autolayout"] = True

# 创建 x 和 y 数据点
x = np.linspace(-5, 5, 50)
y = np.sin(x)

# 绘制 x 和 y 数据点
fig, ax = plt.subplots(1, 1)
p = ax.plot(x, y)

# 在某个点设置 xticks
ax.set_xticks([-1.075])

# 设置点的 xticklabels
ax.set_xticklabels(["$\bf{It\ is -\!1.075\ label}$"])

# 显示图
plt.show()
输出
它会产生以下输出 −