如何使用 matplotlib.pyplot 更改表格的字体大小?
matplotlibpythondata visualization更新于 2023/12/3 16:22:00
要使用 matplotlib 更改表格的字体大小,我们可以使用 set_fontsize() 方法。
步骤
- 创建一个图形和一组子图,nrows=1 和 ncols=1。
- 使用 numpy 创建随机数据。
- 创建 columns 值。
- 使轴 紧密 和 关闭。
- 初始化变量 fontsize 以更改字体大小。
- 使用 set_font_size() 设置表格的字体大小方法。
- 要显示图形,请使用 show() 方法。
示例
import numpy as np
from matplotlib import pyplot as plt
plt.rcParams["figure.figsize"] = [7.00, 3.50]
plt.rcParams["figure.autolayout"] = True
fig, axs = plt.subplots(1, 1)
data = np.random.random((10, 3))
columns = ("Column I", "Column II", "Column III")
axs.axis('tight')
axs.axis('off')
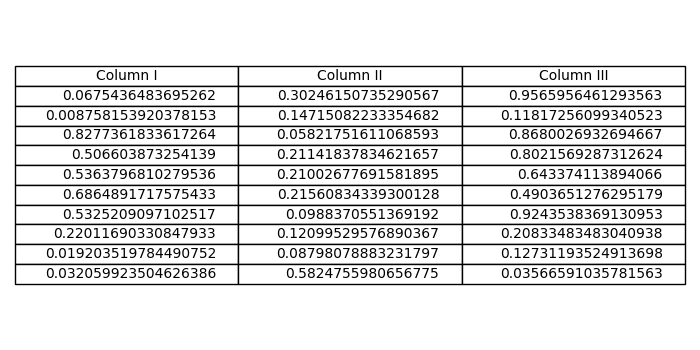
the_table = axs.table(cellText=data, colLabels=columns, loc='center')
the_table.auto_set_font_size(False)
the_table.set_fontsize(10)
plt.show()
输出