如何更改颜色并向 Python Matplotlib 曲面图添加网格线?
matplotlibpythondata visualization
要更改颜色并向 Python 曲面图添加网格线,我们可以采取以下步骤 −
设置图形大小并调整子图之间和周围的填充。
使用 numpy 创建 x、y 和 h 数据点。
创建新图形或激活现有图形。
使用 figure(来自步骤 3)获取 3D 轴对象。
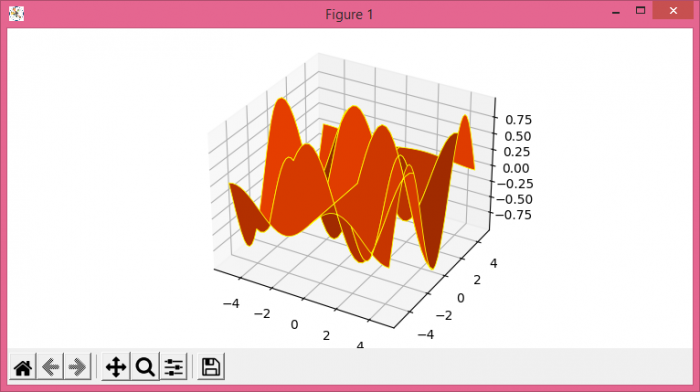
创建曲面图,颜色为橙色,边缘颜色和线宽为橙色。
示例
import numpy as np
import matplotlib.pyplot as plt
from mpl_toolkits.mplot3d import Axes3D

plt.rcParams["figure.figsize"] = [7.50, 3.50]
plt.rcParams["figure.autolayout"] = True

x = np.arange(-5, 5, 0.25)
y = np.arange(-5, 5, 0.25)

x, y = np.meshgrid(x, y)
h = np.sin(x)*np.cos(y)

fig = plt.figure()

ax = Axes3D(fig)
ax.plot_surface(x, y, h, rstride=10, cstride=10, color='orangered', edgecolors='yellow', lw=0.6)

plt.show()
输出