如何使用 Python 的 Bokeh 更改刻度标签大小
Bokeh 是 Python 中可用的数据可视化库之一,它允许用户在 Web 浏览器中创建交互式图表、数据应用程序和仪表板。Bokeh 为我们提供了各种图表,例如散点图、线图、条形图和面积图等,以及更专业的热图和地理地图。这是一个拥有活跃开发者社区的开源库。
在 Python 中使用 Bokeh 创建图表
Bokeh 库提供了两个用于创建图表的主要接口,一个是用于从各个组件开发图表的低级接口,另一个是用于从简单的 Python 代码开发图表的高级接口。高级界面比低级界面更先进,提供了更直观、更简单的方法来创建不同类型的图表。
Bokeh 库支持广泛的选项,允许用户通过添加注释和交互来控制图表,还允许我们包含来自各种来源的数据。
Bokeh 库的功能
以下是 Bokeh 库的主要功能。
它在 Web 浏览器中提供交互式数据可视化。
该库的输出可以是 HTML、PNG 和 SVG。
它支持实时和流式数据。
它还支持地理映射和数据探索。
这可以与 Numpy 和Pandas。
在数据可视化和绘图中,刻度是用于在绘图中识别所显示数据的小标记或指示符。绘图中有两种类型的刻度。一种是 xticks,另一种是 yticks。
安装 Bokeh 库
要在 python 中使用 Bokeh 库,首先我们必须使用以下代码安装该库。
pip install bokeh
在 python 中成功安装 bokeh 库后,将生成以下输出
pip install bokeh
Collecting bokeh
  Downloading bokeh-3.1.1-py3-none-any.whl (8.3 MB)
     ---------------------------------------- 8.3/8.3 MB 44.2 MB/s eta 0:00:00
. . . . . . . . . . . . . . . . . . . . . . . . . . . . . . . . . . . .
. . . . . . . . . . . . . . . . . . . . . . . . . . . . . . . . . . . .
. . . . . . . . . . . . . . . . . . . . . . . . . . . . . . . . . . . .
  Downloading six-1.16.0-py2.py3-none-any.whl (11 kB)
Installing collected packages: pytz, xyzservices, tzdata, tornado, six, PyYAML, pillow, packaging, numpy, MarkupSafe, python-dateutil, Jinja2, contourpy, pandas, bokeh
  Consider adding this directory to PATH or, if you prefer to suppress this warning, use --no-warn-script-location.
  Consider adding this directory to PATH or, if you prefer to suppress this warning, use --no-warn-script-location.
Successfully installed Jinja2-3.1.2 MarkupSafe-2.1.2 PyYAML-6.0 bokeh-3.1.1 contourpy-1.0.7 numpy-1.24.3 packaging-23.1 pandas-2.0.1 pillow-9.5.0 python-dateutil-2.8.2 pytz-2023.3 six-1.16.0 tornado-6.3.2 tzdata-2023.3 xyzservices-2023.2.0
示例
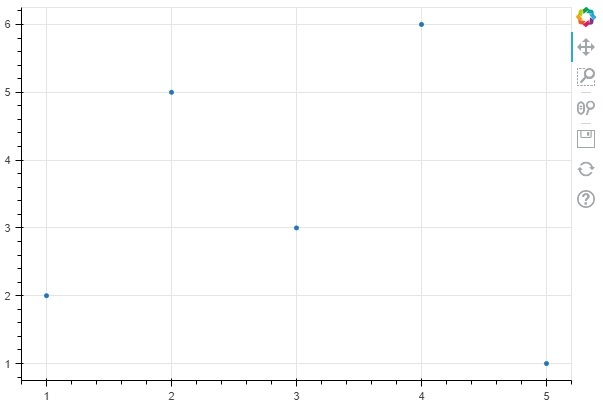
在此示例中,我们将使用 bokeh 库创建绘图,而无需指定绘图中的 tics。以下是可以用作参考的代码。
在下面的代码中,我们从 bokeh 库导入了图形和显示函数,然后指定了绘图的大小并绘制了 x 和 y 变量数据的散点图,最后显示了创建的绘图。
from bokeh.plotting import figure, show
p = figure(width=600, height=400)
x = [1, 2, 3, 4, 5]
y = [2, 5, 3, 6, 1]
p.scatter(x, y)
show(p)
输出
以下是使用 bokeh 库创建的散点图的输出。
示例
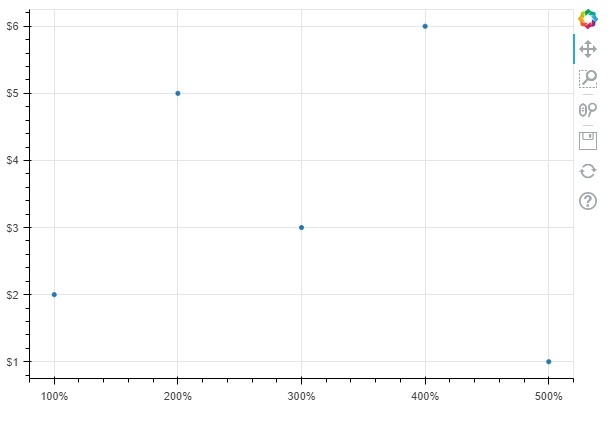
在下面的示例中,我们将使用 bokeh 库的 NumeralTickFormatter() 函数指定刻度。
from bokeh.plotting import figure, show
from bokeh.models import NumeralTickFormatter
p = figure(width=600, height=400)
x = [1, 2, 3, 4, 5]
y = [2, 5, 3, 6, 1]
p.scatter(x, y)
p.yaxis.formatter = NumeralTickFormatter(format="$0,0")
p.xaxis.formatter = NumeralTickFormatter(format = "%0,0")
show(p)
输出
以下是使用 bokeh 函数创建的散点图的输出,其中 x 轴和 y 轴上有刻度。
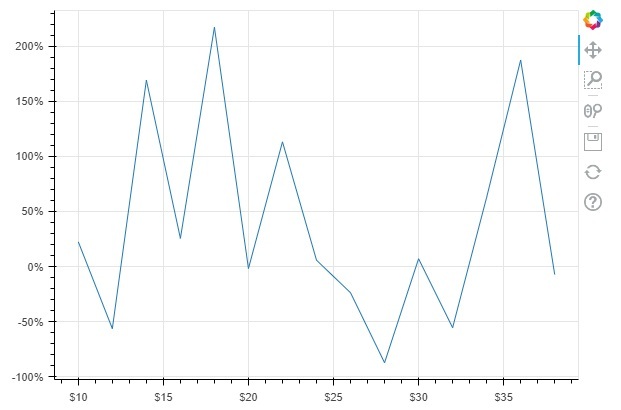
示例
让我们再看一个例子,使用 NumeralTickFormatter() 函数在 x 轴和 y 轴上应用刻度。
from bokeh.plotting import figure, show
from bokeh.models import NumeralTickFormatter
import numpy as np
p = figure(width=600, height=400)
x = np.arange(10,40,2)
y = np.random.randn(20)
p.line(x,y)
p.yaxis.formatter = NumeralTickFormatter(format="%0,0")
p.xaxis.formatter = NumeralTickFormatter(format = "$0,0")
show(p)
输出
以下是使用 scatter() 和 NumeralTickFormatter() 函数绘制的图中使用的刻度输出。