如何在 matplotlib mplot3D 或类似程序中显示 3D 数组等值面的 3D 图?
matplotlibserver side programmingprogramming更新于 2025/5/5 18:37:17
让我们举个例子来看看如何在 matplotlib 中显示 3D 数组等值面的 3D 图 −
示例
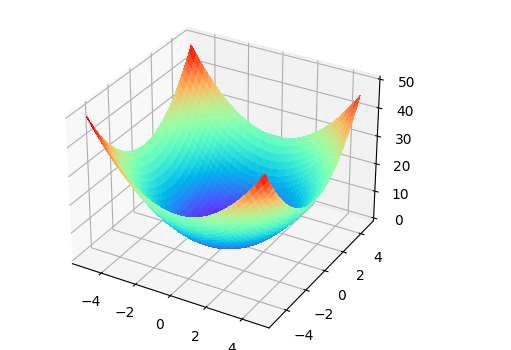
import numpy as np
import matplotlib.pyplot as plt
from mpl_toolkits.mplot3d import Axes3D
plt.rcParams["figure.figsize"] = [7.50, 3.50]
plt.rcParams["figure.autolayout"] = True
x = np.arange(-5, 5, 0.25)
y = np.arange(-5, 5, 0.25)
x, y = np.meshgrid(x, y)
h = x ** 2 + y ** 2
fig = plt.figure()
ax = Axes3D(fig)
ax.plot_surface(x, y, h, rstride=1, cstride=1, cmap=plt.cm.rainbow, linewidth=0, antialiased=False)
plt.show()
输出