如何获取 matplotlib.pyplot.scatter 的默认蓝色?
matplotlibpythondata visualization更新于 2023/12/3 15:00:00
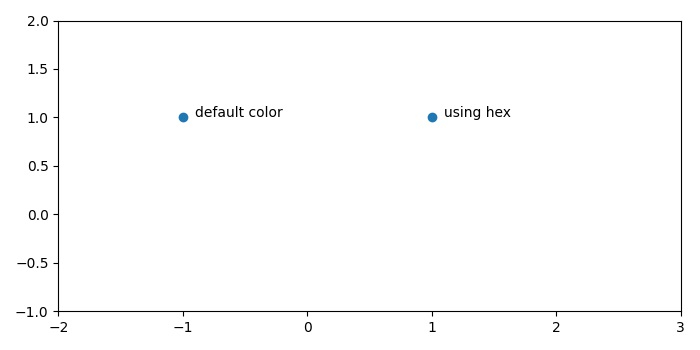
散点的默认颜色是蓝色。要获取 matplotlib 散点的默认蓝色,我们可以使用 annotate() 方法对其进行注释。
步骤
- 使用 subplots() 方法创建一个图形和一组子图。
- 在 (-1, 1) 位置绘制一个散点。
- 为该点添加一些标签。
- 在 (-0.9, 1) 位置绘制一个散点。
- 为该点添加一些标签。
- 在 (1.9, 1) 位置绘制一个散点。
- 为该点添加一些标签。
- 使用 xlim 和 ylim 方法缩放 x 和 y 轴。
- 要显示图形,请使用 show() 方法。
示例
from matplotlib import pyplot as plt
plt.rcParams["figure.figsize"] = [7.00, 3.50]
plt.rcParams["figure.autolayout"] = True
fig, ax = plt.subplots()
ax.scatter(-1, 1)
ax.annotate("default color", xy=(-0.9, 1))
ax.scatter(1, 1, c='#1f77b4')
ax.annotate("using hex", xy=(1.1, 1))
ax.set_xlim(-2, 3)
ax.set_ylim(-1, 2)
plt.show()
输出