如何使用 Matplotlib(Python) 在单页上绘制多个图?
matplotlibserver side programmingprogramming更新于 2025/5/11 15:52:17
使用 plt.figure() 创建一个图形,然后使用 subplot(221) 方法将其拆分成多个部分,其中 nrows=2、nlos=2,(1,2,3,4) 表示索引位置。
步骤
使用 figure() 方法创建一个新图形或激活一个现有图形。
使用 subplot() 方法向当前图形添加一个子图,其中 nrows = 2、ncols = 2 且 index = 1。
使用 subplot() 方法向当前图形添加一个子图,其中 nrows = 2、ncols = 2 且 index = 2。
向当前图形,使用 subplot() 方法,其中 nrows = 2,ncols = 2,index = 3。
使用 subplot() 方法向当前图形添加子图,其中 nrows = 2,ncols = 2,index = 4
要显示图形,我们可以使用 plt.show() 方法。
示例
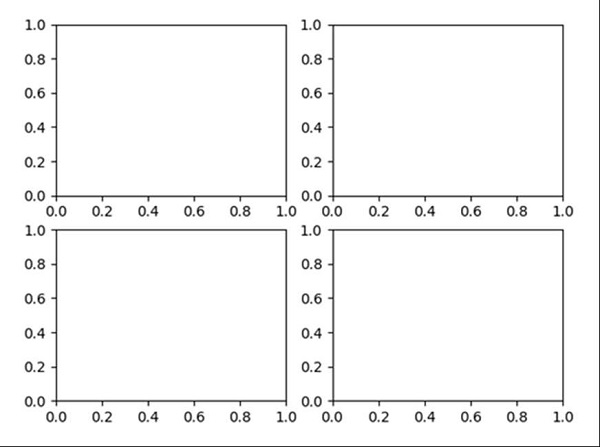
from matplotlib import pyplot as plt

fig = plt.figure()
plt.subplot(221)
plt.subplot(222)
plt.subplot(223)
plt.subplot(224)
plt.show()
输出