如何使用 Matplotlib 在单个页面上绘制多个图?
matplotlibserver side programmingprogramming更新于 2025/5/11 15:22:17
我们可以使用 plt.figure() 方法创建一个图形,并使用 fig.add_subplot(211) 创建坐标轴,其中 nrow=2 且 ncols=1。之后,我们可以在一个图形中绘制覆盖两个图的线条。
步骤
使用 gcf() 方法获取当前图形。如果当前图形不存在,则使用 `~.pyplot.figure()` 创建一个新图形。
使用 add_subplot() 方法将 `~.axes.Axes` 添加到图形中作为子图排列的一部分,其中 nrows = 2、ncols = 1 且位置 = 1。
使用 plt.plot() 方法在位置 1 处绘制线条。
使用 add_subplot() 方法将 `~.axes.Axes` 添加到图形中作为子图排列的一部分,其中 nrows = 2、ncols = 1 且位置 = 2。
使用 plt.plot() 方法在位置 2 处绘制线条。
要显示图形,请使用 plt.show() 方法。
示例
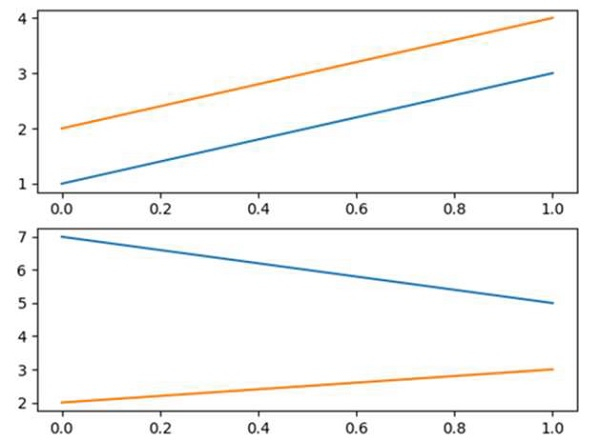
from matplotlib import pyplot as plt

fig = plt.figure()

ax1 = fig.add_subplot(211)
ax1.plot([(1, 2), (3, 4)])

ax2 = fig.add_subplot(212)
ax2.plot([(7, 2), (5, 3)])

plt.show()
输出