如何绘制包含所有 xticks 的 Pandas 多索引数据框(Matplotlib)?
matplotlibpythondata visualization更新于 2023/11/17 2:35:00
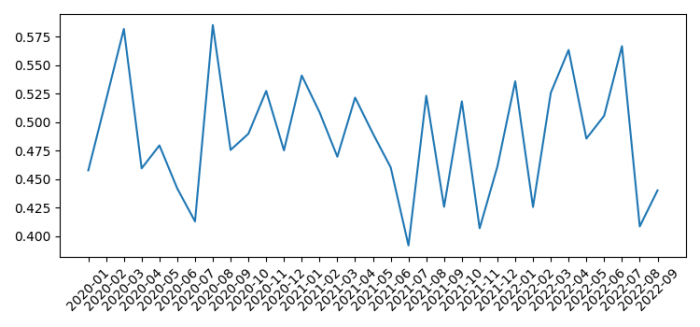
要绘制包含所有 xticks 的 Pandas 多索引数据框,我们可以采取以下步骤 −
- 设置图形大小并调整子图之间和周围的填充。
- 使用 1000 个样本数据创建索引值。
- 创建带有轴标签的一维 ndarray。
- 获取系列的平均值。
- 绘制 g 数据框。
- 在当前轴上设置刻度和刻度标签
- 要显示图形,请使用 show() 方法。
示例
import numpy as np
import matplotlib.pyplot as plt
import pandas as pd

plt.rcParams["figure.figsize"] = [7.50, 3.50]
plt.rcParams["figure.autolayout"] = True

idx = pd.date_range("2020-01-01", periods=1000)
val = np.random.rand(1000)
s = pd.Series(val, idx)

g = s.groupby([s.index.year, s.index.month]).mean()

ax = g.plot()
ax.set_xticks(range(len(g)))
ax.set_xticklabels(["%s-%02d" % item for item in g.index.tolist()],
rotation=45, ha='center')

plt.show()
输出