如何使用 Matplotlib 在 Subplot 中绘制多个 Seaborn 联合图?
matplotlibserver side programmingprogramming
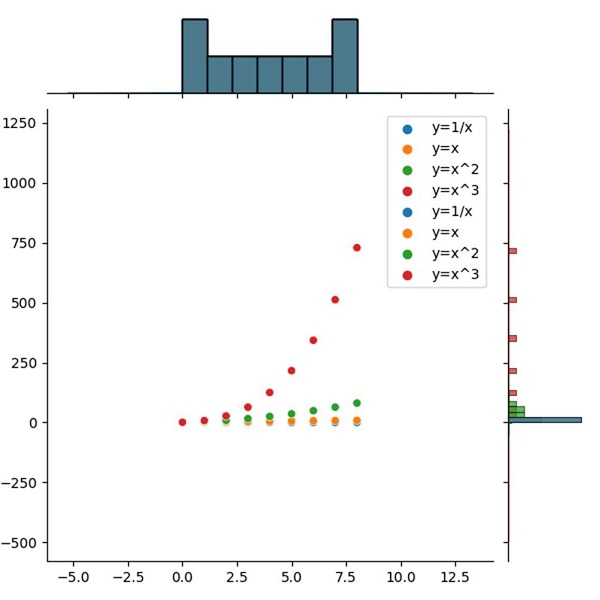
要绘制多个 Seaborn 联合图,我们可以使用 jointplot() 方法。
步骤
向当前图形添加一个子图。
创建一个包含一些键的字典。
使用 Pandas 创建一个数据框。
使用 jointplot() 方法创建联合图。
要绘制曲线,请使用 plot() 方法。
要显示图形,请使用 show() 方法。
示例
from matplotlib import pyplot as plt
import pandas as pd
import seaborn as sns
plt.rcParams["figure.figsize"] = [7.50, 3.50]
plt.rcParams["figure.autolayout"] = True
plt.subplot()
d = {
   'y=1/x': [1 / i for i in range(1, 10)],
   'y=x': [i for i in range(1, 10)],
   'y=x^2': [i * i for i in range(1, 10)],
   'y=x^3': [i * i * i for i in range(1, 10)]
}
df = pd.DataFrame(d)
jg = sns.jointplot(data=df)
jg.plot(sns.scatterplot, sns.histplot)
plt.show()
输出