如何将 Matplotlib 矩形边缘设置为指定宽度之外?
matplotlibpythondata visualization
要将 Matplotlib 矩形边缘设置为指定宽度之外,我们可以采取以下步骤 −
- 设置图形大小并调整子图之间和周围的填充。
- 创建新图形或激活现有图形。
- 将斧头添加到图形作为子图布置的一部分。
- 初始化变量 line_width 以将矩形设置为指定宽度之外。使用变量 xy、w 和 h 表示矩形的中心、宽度和高度。
- 获取一个矩形实例,其中包含 xy 锚点及其高度和宽度。
- 获取偏移变换框实例。
- 添加艺术家补丁 r(步骤 5)。
- 获取 OffsetBox 实例的容器。
- 向容器框添加注释框 ab。
- 要显示图形,请使用 show() 方法。
示例
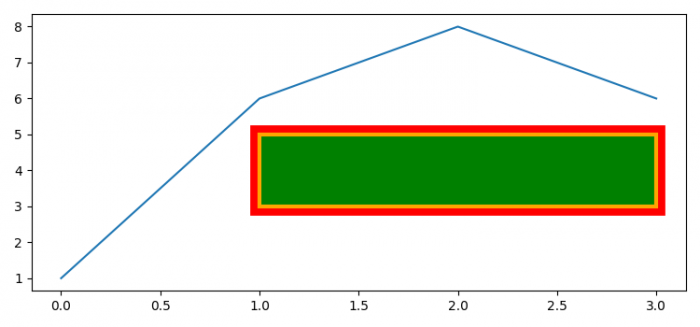
import matplotlib.pyplot as plt
from matplotlib.patches import Rectangle
from matplotlib.offsetbox import AnnotationBbox, AuxTransformBox

plt.rcParams["figure.figsize"] = [7.50, 3.50]
plt.rcParams["figure.autolayout"] = True

fig = plt.figure()

ax = fig.add_subplot(111)
ax.plot([1, 6, 8, 6])

line_width = 7
xy, w, h = (1, 3), 2, 2
r = Rectangle(xy, w, h, fc='green', ec='orange', lw=3)

offsetbox = AuxTransformBox(ax.transData)
offsetbox.add_artist(r)

ab = AnnotationBbox(offsetbox, (xy[0] + w /, xy[1] + w /),
   boxcoords="data", pad=0.52, fontsize=line_width,
   bboxprops=dict(facecolor="none", edgecolor='r',
   lw=line_width))
ax.add_artist(ab)

plt.show()
输出