如何抑制 Matplotlib 警告?
matplotlibserver side programmingprogramming
我们来举个例子。我们创建一组数据点,使其生成一些警告。我们将创建从 -1 到 1 的数据点 x,并尝试在该范围内找到对数,这意味着在计算对数时,值为 0 时会抛出错误。
步骤
- 使用 numpy 创建 x 的数据点并计算 log(x)。
- 使用 plot() 方法绘制 x 和 y。
- 使用 warnings.filterwarnings("ignore") 来隐藏警告。
- 要显示图形,请使用 show() 方法。
示例
import numpy as np
from matplotlib import pyplot as plt
import warnings
plt.rcParams["figure.figsize"] = [7.00, 3.50]
plt.rcParams["figure.autolayout"] = True
warnings.filterwarnings("ignore")
x = np.linspace(-1, 1, 10)
y = np.log(x)
plt.plot(x, y)
plt.show()
输出
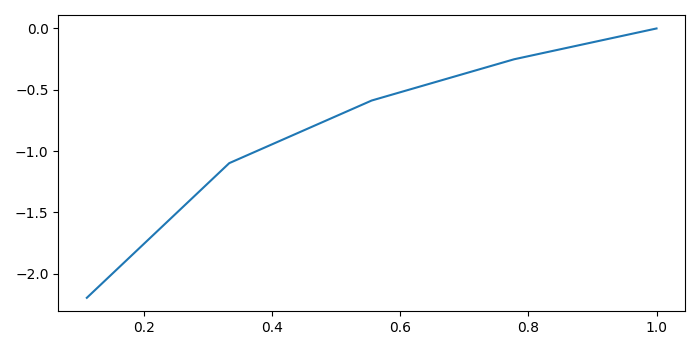
执行代码时,它会隐藏警告并显示以下图表。
现在,删除 warnings.filterwarnings("ignore") 这行代码,然后再次执行代码。它将显示图表,但会发出运行时警告。
RuntimeWarning: invalid value encountered in log

