Matplotlib 中具有不同比例的多个坐标轴
matplotlibserver side programmingprogramming
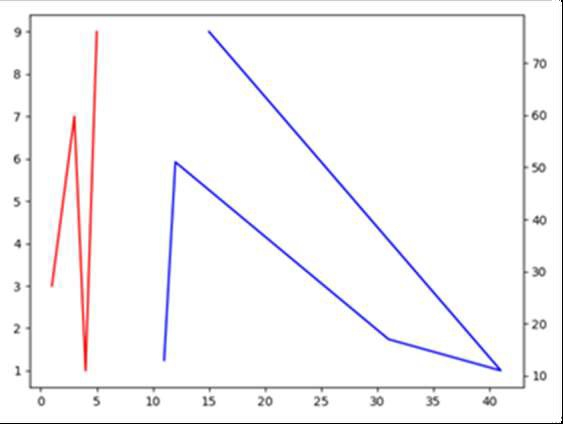
在下面的代码中,我们将了解如何创建共享的 Y 轴。
步骤
使用 subplots 方法创建 fig 和 ax 变量,其中默认的 nrows 和 ncols 为 1。
使用 plot() 方法的参数传入的列表绘制线条,颜色为"red"。
创建两个 Axes 轴,它们共享 X 轴,但 Y 轴相互独立。
在步骤 3 中创建的 ax2 上绘制线条。
调整子图之间和周围的填充。
要显示图形,请使用 plt.show() 方法。
示例
import matplotlib.pyplot as plt
fig, ax1 = plt.subplots()
ax1.plot([1, 2, 3, 4, 5], [3, 5, 7, 1, 9], color='red')
ax2 = ax1.twinx()
ax2.plot([11, 12, 31, 41, 15], [13, 51, 17, 11, 76], color='blue')
fig.tight_layout()
plt.show()
输出