在 Python Matplotlib 中绘制两个共享同一 Y 轴的水平条形图
matplotlibpythondata visualization更新于 2023/11/15 10:13:00
要绘制两个共享同一 Y 轴的水平条形图,我们可以在 subplot() 方法中使用 sharey=ax1,对于水平条形图,我们可以使用 barh() 方法。
步骤
- 创建数据点列表。
- 使用 figure() 方法创建新图形或激活现有图形
- 使用 subplot() 方法在 index=1 处向当前图形添加子图。
- 使用 barh() 方法在轴 1 上绘制水平条形图。
- 使用 subplot() 方法在当前图形中添加子图index=2。共享轴 1 的 Yaxis。
- 在轴 2 上绘制水平条。
- 要显示该图,请使用 show() 方法。
示例
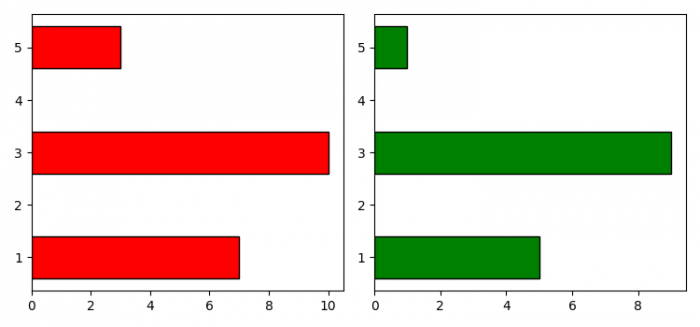
import matplotlib.pyplot as plt
import numpy as np

plt.rcParams["figure.figsize"] = [7.50, 3.50]
plt.rcParams["figure.autolayout"] = True

y = [3, 1, 5]
x1 = [10, 7, 3]
x2 = [9, 5, 1]

fig = plt.figure()

axe1 = plt.subplot(121)
axe1.barh(y, x1, align='center', color='red', edgecolor='black')

axe2 = plt.subplot(122, sharey=axe1)
axe2.barh(y, x2, align='center', color='green', edgecolor='black')

plt.show()
输出