使用 Matplotlib 中的轴对象设置活动子图
matplotlibpythondata visualization更新于 2023/11/17 17:05:00
要在 matplotlib 中设置活动子图轴对象,我们可以使用 subplots() 方法将轴添加为子图排列。
步骤
设置图形大小并调整子图之间和周围的填充。
为数据点创建 x 和 y 列表。
使用 subplots() 方法创建一个图形和一组子图,其中一行和两列。
向当前图形添加一个轴并使其成为当前轴,轴对象位于第 0 个索引处。
使用 plot() 方法绘制 x 和 y 数据点。
添加一个轴到当前图形并使其成为当前轴,轴对象位于第一个索引处。
使用 plot() 方法绘制 x 和 y 数据点。
要显示图形,请使用 show() 方法。
示例
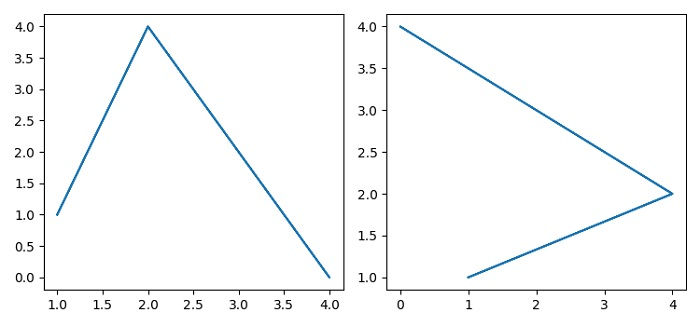
import matplotlib.pyplot as plt

plt.rcParams["figure.figsize"] = [7.50, 3.50]
plt.rcParams["figure.autolayout"] = True

x = [1, 2, 4, 2, 1]
y = [1, 4, 0, 4, 1]

fig, axs = plt.subplots(1, 2)

plt.axes(axs[0])
plt.plot(x, y)

plt.axes(axs[1])
plt.plot(y, x)

plt.show()
输出