如何检查基础 R 中绘图生成时间的差异?
r programmingserver side programmingprogramming更新于 2025/4/11 14:22:17
R 中最常用的时间测量函数之一是 microbenchmark 包中的 microbenchmark 函数。我们可以传递该函数在 microbenchmark 函数中创建绘图,这将得出每个绘图的处理时间,然后可以对差异进行比较。
示例 1
加载 microbenchmark 包:
> library(microbenchmark)
查找绘图生成时间:
> x1<-rpois(10,5)
> x2<-rpois(100,5)
> x3<-rpois(1000,5)
> X<-microbenchmark(plot(x1),plot(x2),plot(x3))
> X
单位:毫秒
   expr      min    lq       mean     median uq       max  neval
plot(x1) 12.7488 14.88815 15.65040 15.2515 15.90765 23.9348  100
plot(x2) 20.9810 21.67780 23.92976 22.2116 23.29665 137.2474 100
plot(x3) 93.6965 95.03440 96.67086 95.6717 97.12290 125.3670 100
Plots:
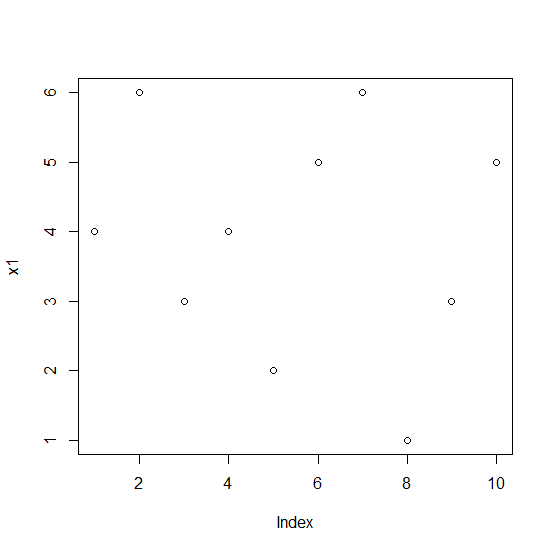
示例
> plot(x1)
输出:
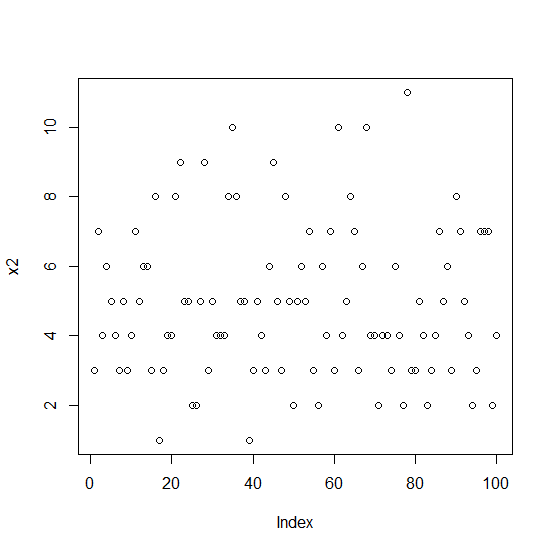
示例
> plot(x2)
输出:
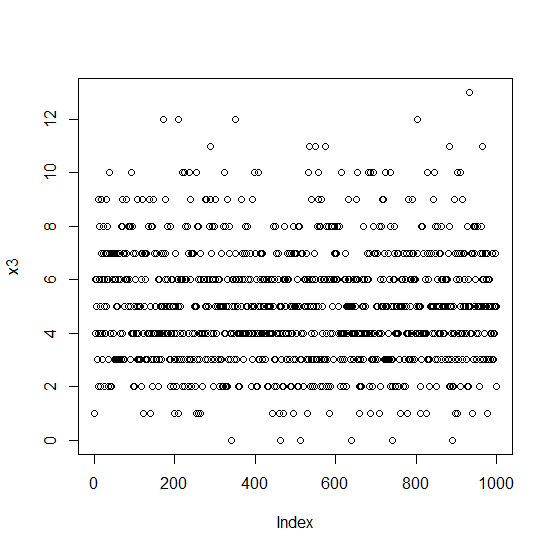
示例
> plot(x3)
输出: