如何使用 R 中的 ggplot2 在绘图标题中显示分数?
r programmingserver side programmingprogramming更新于 2025/4/4 20:52:17
要使用 R 中的 ggplot2 在绘图标题中显示分数,我们可以使用 ggplot2 包的 ggtitle 函数中的 frac 函数。通常,分数显示为 X/Y,但 frac 函数有助于以 over 形式创建分数。
查看以下示例,了解如何使用 ggplot2 在绘图标题中显示 over 形式的分数。
示例
以下代码片段创建了一个示例数据框 −
x<-rnorm(20)
y<-rnorm(20)
df<-data.frame(x,y)
df
创建以下数据框 −
       x            y
1   0.23483738  1.4506593
2  -0.53391645 -0.6103884
3   0.43178470  0.9607968
4  -0.02202213  0.9308459
5  -0.67083342 -1.3704258
6  -1.01972845 -0.7536449
7  -0.41450037  1.7233977
8   0.65886251  0.9757482
9   1.47215186  0.2239160
10 -0.50323646  0.3078364
11 -0.75307929  0.6244623
12  0.43689883  1.4064075
13 -0.47781745 -0.6764910
14 -0.21645828  1.3042513
15 -0.39136288 -1.6218892
16 -0.10340456  0.2913214
17  0.41817242  1.6793330
18 -1.21634661 -2.2519936
19 -0.20690016 -0.0327693
20  0.38731829  0.6627035
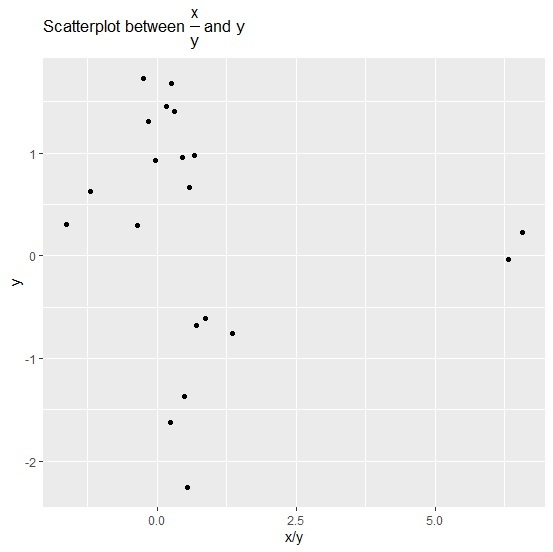
要加载 ggplot2 包并在 x 和 y 之间创建点图,且绘图标题以超过的形式显示分数,请将以下代码添加到上述代码片段中 −
library(ggplot2)
ggplot(df,aes(x/y,y))+geom_point()+ggtitle(expression(paste("Scatterplot between ", frac(x,y), " and y")))
输出
如果将上述所有代码片段作为单个程序执行,则会生成以下输出 −