如何使用`bins = 30`处理警告消息`stat_bin()`。使用`binwidth`选择更好的值。在 R 中创建直方图?
r programmingserver side programmingprogramming更新于 2025/4/12 0:37:17
bins 的默认值为 30,但如果我们不在 geom_histogram 中传递该值,则大多数情况下 R 都会显示警告消息。为了避免这种情况,我们可以简单地将 bins=30 放在 geom_histogram() 函数中。这将停止显示警告消息。
考虑下面的数据框 −
x<-rnorm(50000,5,1)
df<-data.frame(x)
加载 ggplot2 包并创建 x 的直方图 −
示例
library(ggplot2) ggplot(df,aes(x))+geom_histogram() `stat_bin()` using `bins = 30`. Pick better value with `binwidth`.
输出

通过指定箱位创建直方图 −
示例
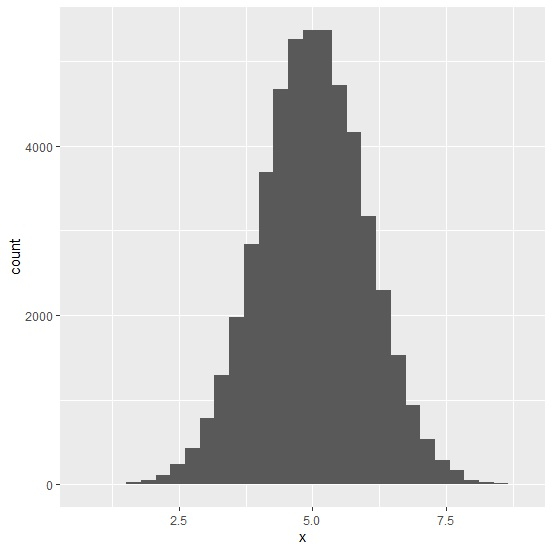
ggplot(df,aes(x))+geom_histogram(bins=30)
输出