如何让函数在 Python 中返回图形(使用 Matplotlib)?
matplotlibpythondata visualization
要让函数在 Python 中返回图形(使用 Matplotlib),我们可以采取以下步骤 −
设置图形大小并调整子图之间和周围的填充。
使用 numpy 创建 x 和 y 数据点。
创建一个函数 plot(x, y),使用 figure() 方法创建新图形或激活现有图形。
使用 plot() 方法绘制 x 和 y 数据点;返回图形实例。
调用 plot(x, y) 方法并将图形实例存储在变量 f 中。
要显示图形,请使用 show() 方法。
示例
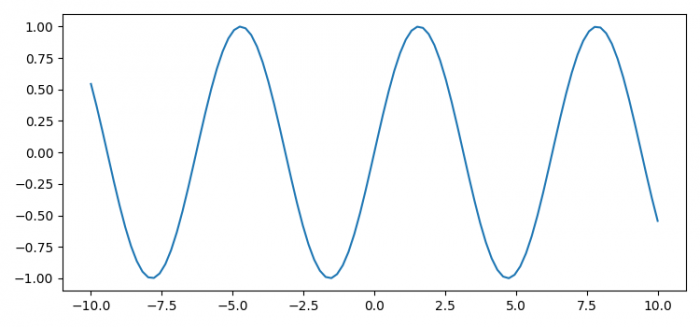
import numpy as np
from matplotlib import pyplot as plt

plt.rcParams["figure.figsize"] = [7.50, 3.50]
plt.rcParams["figure.autolayout"] = True

def plot(x, y):
   fig = plt.figure()
   plt.plot(x, y)
   return fig

x = np.linspace(-10, 10, 100)
y = np.sin(x)

f = plot(x, y)

plt.show()
输出