如何使用 Matplotlib 在极坐标中制作箭筒图?
matplotlibpythondata visualization
要使用 Matplotlib 在极坐标中制作箭筒图,我们可以采取以下步骤 −
设置图形大小并调整子图之间和周围的填充。
使用 numpy 创建 radii、thetas、theta 和 r 数据点。
创建新图形或激活现有图形。
将 'ax' 添加到图形作为子图布置的一部分。
制作箭头的多边形集合。
要显示图形,请使用 show()方法。
示例
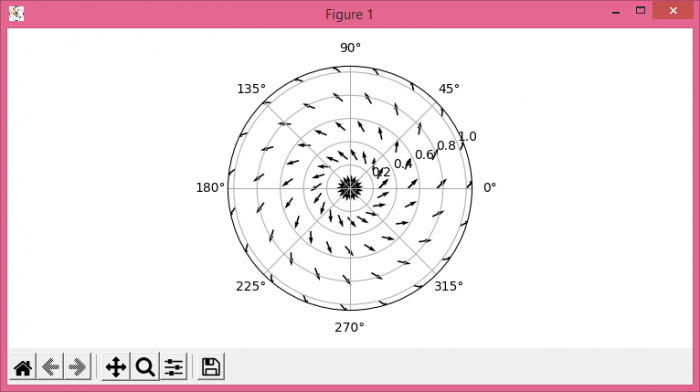
import numpy as np
from matplotlib import pyplot as plt

plt.rcParams["figure.figsize"] = [7.50, 3.50]
plt.rcParams["figure.autolayout"] = True

radii = np.linspace(0, 1, 5)
thetas = np.linspace(0, 2 * np.pi, 20)
theta, r = np.meshgrid(thetas, radii)

f = plt.figure()

ax = f.add_subplot(polar=True)
ax.quiver(theta, r, np.cos(theta) - np.sin(theta), np.sin(theta) + np.cos(theta))

plt.show()
输出