如何在 R 中使用 ggplot2 将图例设置在右上角?
r programmingserver side programmingprogramming更新于 2025/6/25 6:37:17
使用 ggplot2 创建的图中,图例的默认位置在右侧,但我们可以使用 theme 函数(包含 legend.position 参数和 legend.justification 参数)更改其位置。要将图例设置在右上角,我们可以使用 legend.position="top" 和 legend.justification="right"。
示例
考虑以下数据框:
考虑以下数据框:
> x<-c("Mango","Guava","Pomegranate")
> freq<-c(212,220,218)
> df<-data.frame(x,freq)
> df
输出
x freq
1 Mango 212
2 Guava 220
3 Pomegranate 218
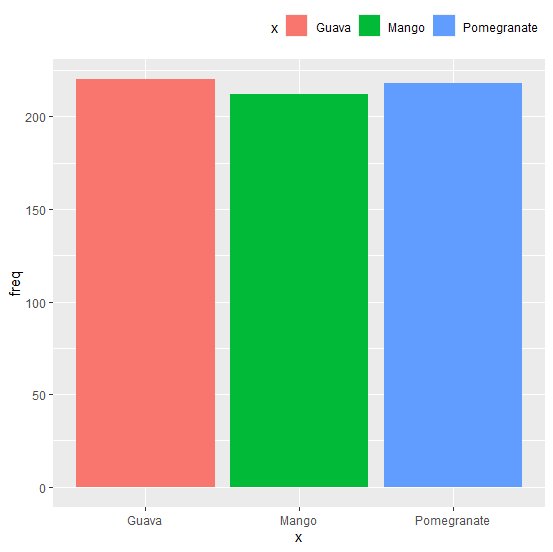
加载 ggplot2 包并创建带图例的条形图:
> library(ggplot2)
> ggplot(df,aes(x,freq,fill=x))+geom_bar(stat="identity")
输出:
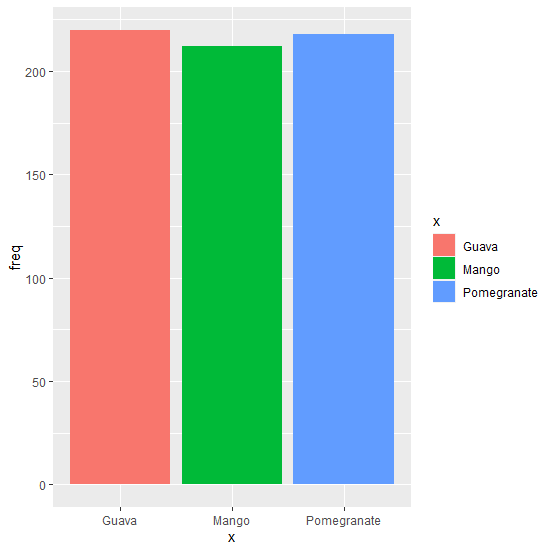
创建条形图,并在图表右上角添加图例:
示例
> ggplot(df,aes(x,freq,fill=x))+geom_bar(stat="identity")+theme(legend.position="top",legend.justification="right")
输出: