在 Matplotlib 中创建两个子图后,如何共享它们的 x 轴?
matplotlibserver side programmingprogramming
首先,我们可以使用 subplot 方法创建两个轴,其中 nrows=2,ncols=1。这意味着,我们可以用两个索引来绘制所需的图。我们可以使用 ax1.get_shared_x_axes().join(ax1,ax2) 方法绘制图表。
步骤
创建两个数字列表。
向当前图形 ax1 添加一个子图,其中 ax1 的 nrows = 2、ncols = 1,index 为 1。
向当前图形 ax2 添加一个子图,其中 ax2 的 nrows = 2、ncols = 1,index 为 2。
使用步骤 1 中创建的点绘制 x 和 y 坐标。
使用 get_shared_x_axes().join(ax1, ax2),返回对共享轴 Grouper 对象的引用坐标轴。
使用 set_xticklabels 方法设置网格的 X 轴刻度标签(空列表)。
使用 plt.show() 显示图形。
示例
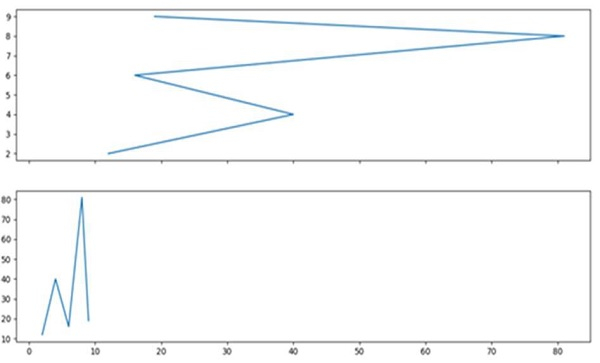
import matplotlib.pyplot as plt

x = [2, 4, 6, 8, 9]
y = [12, 40, 16, 81, 19]

ax1 = plt.subplot(211)
ax2 = plt.subplot(212)

ax1.plot(y, x)
ax2.plot(x, y)

ax1.get_shared_x_axes().join(ax1, ax2)
ax1.set_xticklabels([])

plt.show()
输出