如何在 Matplotlib/Pyplot 中同时缩放子图?
matplotlibserver side programmingprogramming
我们可以使用属性 sharex = "ax1",然后使用 subplot 方法将子图同时缩放。
步骤
使用 (nrow = 1, ncols = 2, index = 1) 向当前图形添加子图。
使用 (nrow = 1, ncols = 2, index = 1) 在当前子图上添加线条。
使用 (nrow = 1, ncols = 2, index = 2) 在当前图形上添加子图。
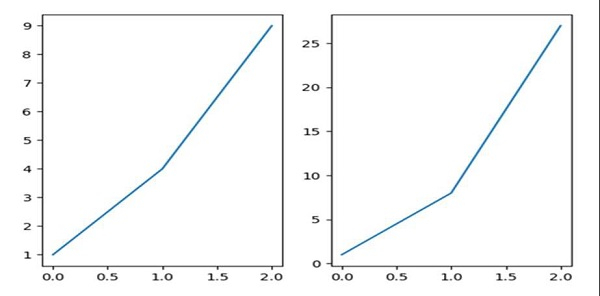
使用 (nrow = 1, ncols = 2, index = 2) 在当前子图上添加线条,其中 sharex 可以帮助共享 x 或y `~matplotlib.axis` 与 sharex 和/或 sharey 一起使用。该轴将具有与共享轴区相同的范围、刻度和比例。
使用 plt.show() 显示图形。
示例
from matplotlib import pyplot as plt
ax1 = plt.subplot(1, 2, 1)
ax1.plot([1, 4, 9])
ax2 = plt.subplot(1, 2, 2, sharex=ax1)
ax2.plot([1, 8, 27])
plt.show()
输出