在 Matplotlib 中增加标题和绘图之间的距离
matplotlibserver side programmingprogramming
要在 Matplotlib 中增加标题和绘图之间的距离,我们可以采取以下步骤 −
使用 numpy 创建点 x。
使用 numpy sin 创建点 y。
设置绘图的标题。更改 y 值(参数中)后,我们可以增加或减少标题和绘图之间的距离。
使用 plot() 方法绘制 x 和 y 点,其中颜色为红色,线宽为 2。
要显示图形,请使用 show() 方法。
示例
import numpy as np
from matplotlib import pyplot as plt
plt.rcParams["figure.figsize"] = [7.50, 3.50]
plt.rcParams["figure.autolayout"] = True
x = np.linspace(1, 10, 1000)
y = np.sin(x)
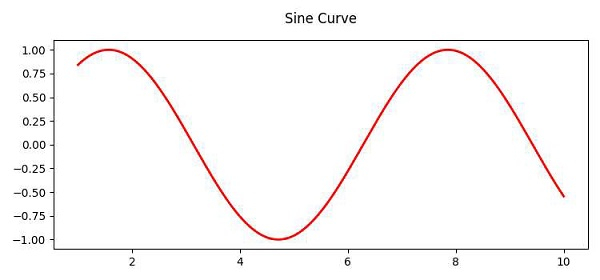
ttl = plt.title('Sine Curve', y=1.05)
plt.plot(x, y, c="red", lw=2)
plt.show()
输出