如何在 PyTorch 中计算张量的直方图?
pythonpytorchserver side programmingprogramming
使用 torch.histc() 计算张量的直方图。它返回以张量表示的直方图。它需要四个参数:input、bins、min 和 max。它将元素排序到 min 和 max 之间的等宽 bin 中。它会忽略小于 min 和大于 max 的元素。
步骤
导入所需的库。在以下所有 Python 示例中,所需的 Python 库是 torch 和 Matplotlib。确保您已经安装了它们。
创建一个张量并打印它。
计算torch.histc(input, bins=100, min=0, max=100)。它 返回直方图值的张量。根据需要将 bins、min 和 max 设置为 适当的值。
打印上面计算的直方图。
将直方图可视化为条形图。
示例 1
# 用于计算张量直方图的 Python 程序
# 导入必要的库
import torch
import matplotlib.pyplot as plt

# 创建张量
T = torch.Tensor([2,3,1,2,3,4,3,2,3,4,3,4])
print("Original Tensor T:\n",T)

# 计算上面创建的张量的直方图
hist = torch.histc(T, bins = 5, min = 0, max = 4)
print("T 的直方图:\n", hist)
输出
原始张量 T:
   tensor([2., 3., 1., 2., 3., 4., 3., 2., 3., 4., 3., 4.])
T 的直方图:
   tensor([0., 1., 3., 5., 3.])
示例 2
# 计算张量直方图的 Python 程序
# 导入必要的库
import torch
import matplotlib.pyplot as plt
# 创建张量
T = torch.Tensor([2,3,1,2,3,4,3,2,3,4,3,4])
print("Original Tensor T:\n",T)
# 计算上述创建的张量的直方图
hist = torch.histc(T, bins = 5, min = 0, max = 4)
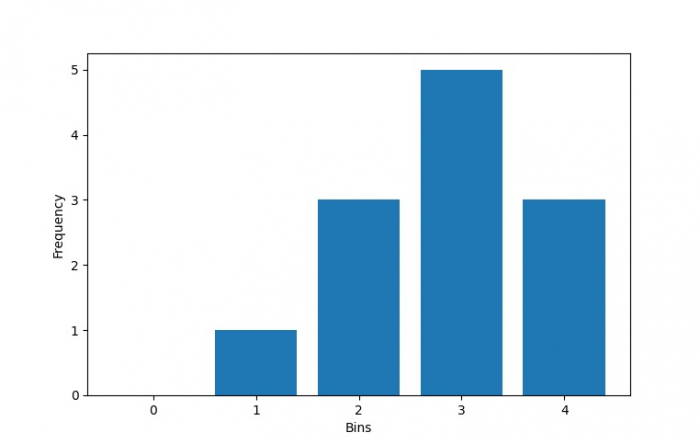
# 将上述计算出的直方图可视化为条形图
bins = 5
x =范围(bins)
plt.bar(x,hist,align='center')
plt.xlabel('Bins')
plt.ylabel('Frequency')
plt.show()
输出
原始张量 T:
   tensor([2., 3., 1., 2., 3., 4., 3., 2., 3., 4., 3., 4.])